Customer Experience IndexInfographic

infographic Transcript (Expand)
Why Develop a CX Index?
Overarching measure of Brand A’s CX health.
Captures customer’s perceived past, present, and future customer experiences & behaviors.
- Past: Overall experience
- Present: Personal preference for Brand A
- Future: Likelihood to continue using & likelihood to recommend
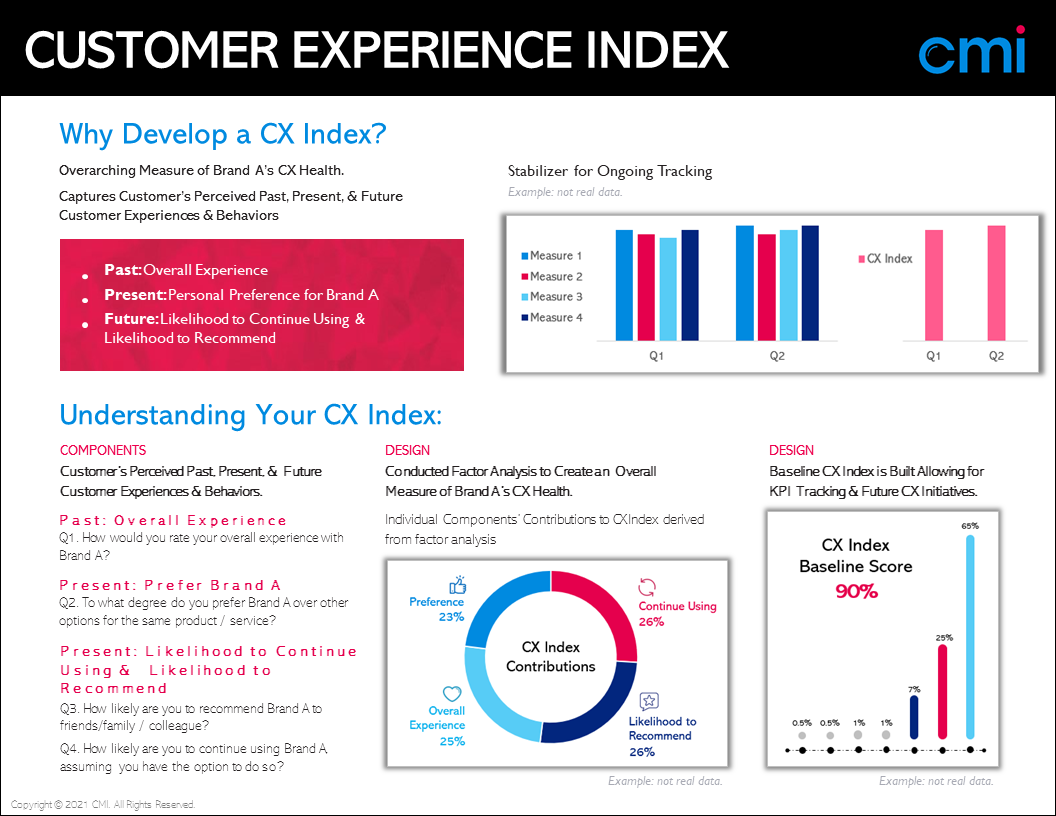
Stabilizer for ongoing tracking (example: not real data).
Understanding Your CX Index:
Components
Customer’s perceived past, present, & future customer experiences & behaviors.
Past: Overall Experience
Q1. How would you rate your overall experience with Brand A?
Present: Prefer Brand A
Q2. To what degree do you prefer Brand A over other options for the same product / service?
Present: Likelihood to Continue Using & Likelihood to Recommend
Q3. How likely are you to recommend Brand A to friends / family / colleague?
Q4. How likely are you to continue using Brand A assuming you have the option to do so?
Design
Conducted factor analysis to create an overall measure of Brand A’s CX health.
Individual components’ contributions to CX Index derived from factor analysis:
- Preference — 23%
- Overall Experience — 25%
- Continue Using — 26%
- Likelihood to Recommend — 26%
Example: not real data.
Design
Baseline CX Index is built allowing for KPI tracking & future CX initiatives.
CX Index Baseline Score: 90%
Example bar chart values: 7%, 25%, 65% (example: not real data).
Copyright © 2021 CMI. All Rights Reserved.
