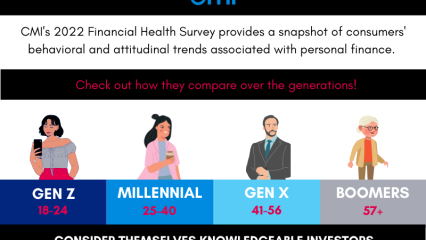
We’ll bring your customer analytics to life with a host of powerful tools including Visually Crisp PowerPoints, Tableau Customer Dashboards, Video Recaps, and Viewpoint™. Our goal is to make data visualization insights accessible, actionable, and compelling for all your stakeholders.
At CMI, we’re not just researchers—we’re storytellers. Anyone can do research, but we’re not anyone. We are constantly looking for fresh new ways to make research compelling. What’s more compelling than a great story with great visuals? Our ingenious team specializes in weaving findings into a colorful, cohesive narrative. We put data to work, inspire market development strategy and share stories that give you an edge.
Visual Outputs & Data Strategy
- Infographics
- PowerPoints
- Tableau Customer Dashboards
- Video Recaps
- Viewpoint Dashboards™
Visualization & Storytelling Related Work
Let's Talk Analytics
We are committed to providing spot-on research to inform your critical business decisions.
Let's Connect


